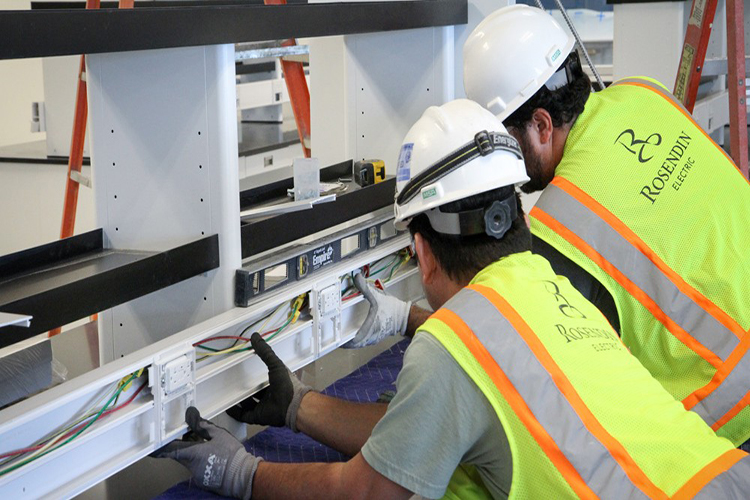
Rosendin Electric workers install wiring. Photo Mark Morgan
by Joe Bousquin
Very soon, Matt Lamb will be able to tell you exactly how long it should take his electricians to install a foot of pipe or wire, by job type, anywhere in the country.
To the uninitiated, that might not sound like a notable achievement. But when it comes to analyzing and leveraging data within the construction industry, that simple metric has the potential to unlock insight into the trades that’s never been accessible before.
“Installing pipe and wire in a hospital is a lot different than installing pipe and wire in a commercial high-rise for condos or in a hotel,” says Lamb, chief information officer at San Jose, Calif.-based Rosendin Electric, one of the largest electrical subcontractors in the U.S. “There’s a lot of different components that go into each environment, and we need to further break that out.”
By focusing on his install rates at various jobs, Lamb’s goal is to be able to identify, with a simple query, jobs where things are going right and, hence, helping Rosendin’s margins, as well as jobs where things are getting delayed, to help stem problems before they have a larger, negative impact.
Looking at both scenarios can help Rosendin improve its internal business processes, as well as its bids, by homing in on the kinds of jobs it does particularly well while knowing the risks involved in the ones that ultimately take longer to complete.
“Beyond that, you start looking at who we did the work for and how margins looked,” says Lamb, who’s leveraging Oracle Analytics Cloud to help parse Rosendin’s data. “How many change orders did we have? All of those data points are helping us build a workflow of questions that can be beneficial in a risk review or even a go/no-go decision on a job.”
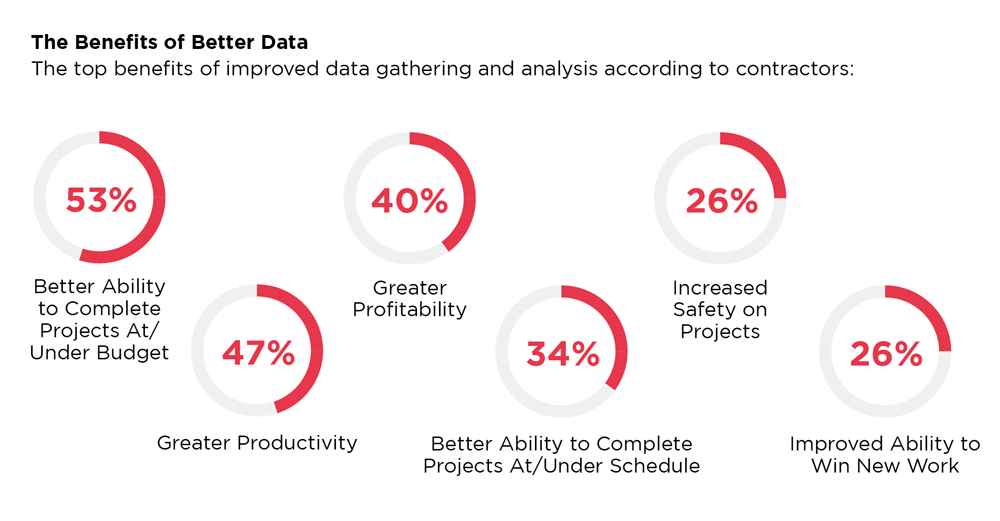
Source: Dodge Data & Analytics survey of construction managers, general contractors, specialty trade contractors and design/build firms in the U.S., Improving Performance With Project Data
Data allows construction firms to conduct deeper analysis of project success.
Lamb’s quest to quantify his firm’s install rates on different jobs highlights the still nascent but emerging trend of leveraging data analysis and data science in the construction industry today. While construction and the trades often take it on the chin when analysts highlight their reputation for being technology averse, with productivity gains that sorely lag other sectors, firms like Rosendin and others are not only using technology to automate processes, they’re now starting to take the next steps to plumb the data they can cull from their technology platforms to actually get better at their jobs.
Take Hinsdale, Ill.-based BrightLeaf Homes, which sells into the Chicagoland market and pulls data from its Buildertrend construction management platform to focus on the timelines and budgets of its builds.
“Our philosophy here is that if you can quantify it, you can improve it,” says Jeremiah Butler, BrightLeaf’s director of operations. “We’re putting the appropriate systems in place to track and log information so we can dig into it and take a look at what we’re seeing in the real world versus our initial expectations going in. Without that data, we couldn’t accurately make any assumptions on where our returns are for our homes versus any other home on the market.”
Beyond being able to conduct post mortems on completed projects, as Rosendin is doing, having the capability to drill down into a job’s margins while it’s still in progress is perhaps the holy grail of using data science in construction today, allowing firms to identify “profit fade” while they can still do something about it.
“To be able to find out halfway through a project that your margins are going to end at half of where you expected is empowering,” says Jeff Dugger, cofounder at Omaha, Neb.-based construction software firm Buildertrend. “It gives you the ability to make some adjustments, find better vendors for products, or figure out a way to self-perform some of the work to get those margins back in line before it’s too late.”
The industry is at the beginning of a data transformation.
But while the promise—and practice—of using data science and business intelligence in construction today surely exists, pioneers in the space also say it has a lot of room to grow. Indeed, a report from Dodge Data & Analytics that surveyed construction firms with billings of at least $10 million annually found that 34% of contractors and subs are now using commercial software to collect data, while 26% employ custom solutions to do so. While those percentages represent significant growth from years past, they’re also still relatively small compared with other industries.
“Understanding data in construction today is really still a mixed bag,” Lamb says. “It depends on contractor size. Small companies are not going to have the resources or understanding to do a lot with it. But even a lot of the bigger ones are still trying to get their heads around it.”
At the same time, practitioners of data gathering and analytics within construction say there’s a certain amount of buzz in the industry currently when it comes to data. “It’s a very topical subject right now,” says Matt Harris, chief product and strategy officer at Portland, Ore.-based Viewpoint, which was recently acquired by construction technology firm Trimble and partnered on the Dodge report. “The digital transformation we’re seeing in the industry at this point is really only a first step to what we describe as the data transformation.”
Access is construction’s low-hanging data fruit.
Part of that transformation comes simply from being able to capture the data in the first place. That means transitioning from paper-based processes onto digital platforms so companies can automate and then analyze.
“The low-hanging fruit for applying data can be as simple as having access to it,” says Shawn Foster, construction lead at Carmel, Ind.-based Allegion, maker of Schlage door hardware, which has developed the Overtur mobile app to help door contractors more easily track jobs during installation. “Simple checklists, intuitive interfaces, and graphs and charts are being used across the industry as a way to get everyone on a project involved and exposed to what is happening on a project. Inclusion is a key theme.”
At Whippany, N.J.-based Star-Lo Electric, which has more than 500 employees, the first trick was simply to get its data into a digital format. The firm used a cloud-based field service management app from New York-based Invonto to get a handle on capturing field data and then used it to increase revenue.
“Capturing, analyzing, and comparing estimates with actual costs for each job helped them find out what was causing project delays,” says Brian Maya, digital marketing associate at Invonto. “Their team was having issues with supplying enough material to finish jobs. The software helped them measure and understand the actual resources they needed.” The result was a 7.5% revenue boost and annual cost savings of $1.15 million.
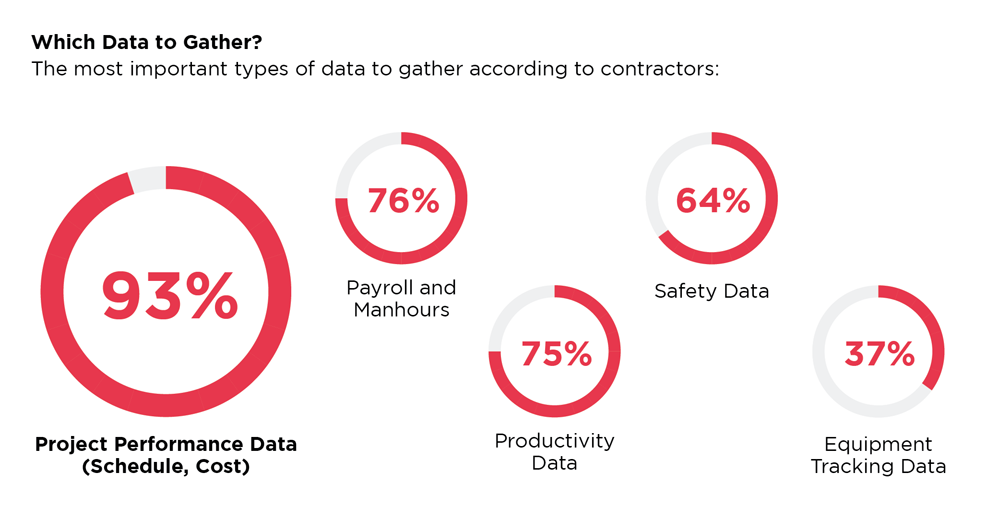
Source: Dodge Data & Analytics survey of construction managers, general contractors, specialty trade contractors, and design/build firms in the U.S., Improving Performance With Project Data
Data science doesn’t have to be rocket science.
While the worlds of data science and business intelligence may still be a head-scratcher for some construction pros, practitioners say you don’t need a dissertation to get started with data.
“Being data-enabled actually can be very straightforward,” says Viewpoint’s Harris. “It’s simple reporting and understanding the profitability of your job. It’s understanding the impact of a change order to the contract value and the potential committed costs and overall margins of your project. It’s reporting on the utilization of your people, your equipment, and the productivity you’ve shown during the course of the day.”
Those themes of simple reporting, inclusion, and accessibility by all team members are a consistent thread among contractors who are using data to get results today.
“The first step for us has been to provide access to the data that we already have,” says CJ Best, construction technology program manager at Seattle-based design-build contractor McKinstry. “Creating easy-to-digest visualizations for our project teams who don’t have time to deep dive into large data sets has been a key step. Those visualizations provide quick access, can alert the team to potential risks, and allow them to make informed decisions on-site.”
For example, McKinstry uses dashboards to help its project teams understand cost differences between its original estimates and shop drawings. It also has daily reports that help teams understand the cost of rework and what’s driving it, through the creation of a “word cloud” that illustrates what’s trending in detailers’ notes.
Getting granular with data is key to process improvement.
Drilling down into data is a key component for leveraging it in construction today, as exemplified by Lamb’s effort to map various piping install rates at different jobs. It’s something Best looks for, too.
“A timesheet program that just captures the numbers of hours worked per day is useful for payroll but doesn’t give much more insight than that,” Best says. “But a program that captures time spent on specific activities like meetings, hardware downtime, and production drawings gives you insight into why a worker might have spent more time on a task. Programs that help management answer the first level of ‘why’ are much more useful for process improvement.”
It’s the outliers that impact you most.
Getting to that “why” is not only critical for improving efficiency, it’s often the difference between success and failure in the construction industry.
“In data science and analytics, there’s a saying that it’s not the median but the variation to the standard deviation that will actually affect you,” says Karthik Venkatasubramanian, vice president, data science and analytics, at Redwood Shores, Calif.-based software giant Oracle. “It doesn’t matter if your average turnaround for a request for information (RFI) is three days. It’s the job where it takes 15 days that’s going to kill your margins and impact you as a company. If you look at companies that have gone broke, that’s been the issue.”
Venkatasubramanian points to a client that used Oracle’s analytics tools to look at its own RFI turnarounds and found the jobs it was lagging on all involved a particular subcontractor. When the company stopped using that firm, its productivity improved 20%.
Indeed, other firms have been able to improve results simply by looking at their outliers. Take Ottawa, Canada-based home renovation company RenosGroup, which employed Dallas, Texas-based AgileCRM to home in on its sales pipeline.
“Our ‘ah-ha’ moment with using data analysis came from tracking sales progress on potential deals,” says Keith Melanson, project manager. “It really opened our eyes to how much time can be lost on deals that never get closed. It reminded us of the 80/20 rule—spend 80% of your time on your current clients and 20% on potential ones.”
If you don’t act, it’s all just numbers.
Key to leveraging data, of course, aside from being able to access and drill down into it, is doing something with it once you have it. For example, at Dallas-based construction management software firm Hyphen Solutions, which counts more than 70,000 users on its home builder and supply chain platforms, CEO Felix Vasquez says taking action on the data once you have it is just as important as capturing it in the first place in order to not make the same mistakes over and over again.
“Variance purchase orders (VPOs) are the bane of builders and suppliers everywhere,” Vasquez says. “But while most companies have spent considerable work automating this process to eliminate delays from VPOs, very few have instituted actual feedback loops to identify and eliminate the most frequent causes of VPOs themselves. How many folks go back and adjust their take-offs, per plan, based on their VPO reports today?”
It’s that kind of self-accountability and follow-up that can really increase the power of the data you collect. “We’ve had builders look at data to see how updates to purchase orders impact supplier on-time performance,” Vasquez recounts. “Let’s just say making changes the day before a supplier needs to be on-site doesn’t help them finish on time.”
The lack of data standardization is an obstacle to shared applications.
And yet, while firms within the industry are notching up wins by leveraging data, standardizing data within construction—both within firms and across the industry so systems can talk to each other externally—is still a huge challenge.
“What we need to do as an industry is come together and standardize how our data looks,” says Nick Martz, director of design technology at Chicago-based Sheehan Nagle Hartray Architects. “If you look at the auto industry, their data is completely standardized and they don’t deviate from it. But in construction, if you’re putting something into a cost-estimating program for a wall system at one firm, it’s not going to be consistent with how wall systems are categorized somewhere else. That’s a big challenge for the data going into our projects.”
The fragmented nature of construction itself only exacerbates the issue.
“What really differs here in the design and construction space versus manufacturing is that you have so many companies involved in the process,” says Scott Unger, CEO of Atlanta-based construction management software firm Kahua. “In design and construction, numerous parties come together one time to create a specific asset and then they all move onto the next project. So when it comes to data, there’s really not a lot of standardization, and that’s been the Achilles heel of our space. You’re really not able to share data very effectively or efficiently across different parties.”
Not that data pros within the industry aren’t trying. Martz points to the data portion of the annual BILT conferences, which happen globally, where design and construction professionals huddle in a pursuit of data standards. “There is a whole data summit that happens at the beginning of the week for that conference where people have endless conversations about why can’t we, as an industry, have one list of parameters that we all use for doors, for example,” Martz says.
Those kinds of efforts, however, aren’t dissimilar to the advent of the use of XML and metadata tags in the early days of the internet. Another parallel are the efforts in the apartment industry of the National Multifamily Housing Council’s annual OPTECH conference, which, long before proptech became a buzzword in the business lexicon, pushed hard to create data standards so different applications within the industry could talk to one another. Today, the explosion of proptech apps for the apartment space is a testament to that effort.
Predictive analytics is the future of data in construction.
Some in construction see similar opportunities today. At Viewpoint, for instance, Harris sees a day in the not-too-distant future where data becomes ubiquitous enough to actually provide predictive analytics, such as being able to predict the likelihood of an accident when certain conditions are in place or even make prescriptive recommendations on potential jobs.
“That’s where things get really interesting,” Harris says. “That’s where it will eventually say, if you want to bid on a low voltage electrical contract for a 30-floor commercial office building, you should bid with this type of margin in mind, because that’s what the data science has pulled from similar projects in the past. That’s the frontier we’re working on today. I think we’re really close.”
From that perspective, while there’s still a lot of work to do, the future of applying data science to construction may be closer than you think.
Joe Bousquin has been covering construction since 2004. A former reporter for the Wall Street Journal and TheStreet.com, Bousquin focuses on the technology and trends shaping the future of construction, development, and real estate. An honors graduate of Columbia University’s Graduate School of Journalism, he resides in a highly efficient, new construction home designed for multigenerational living with his wife, mother-in-law, and dog in Chico, California.
https://www.buildingforward.com/business-finance/how-data-is-shaping-the-future-of-construction_o
